
Howto debug a TYPO3 ExtBase extension with PhpStorm and XDebug
In this article I will show you step by step, how simple it is to setup PhpStorm and XDebug to debug a TYPO3 ExtBase extension. Of course you can also debug every other TYPO3 component with this setup.
Setup
Before you can start with debugging, you need to setup XDebug, a debugging extension for you webbrowser and your PhpStorm project.
XDebug Setup
First you need to install XDebug on you system and add the following lines to your xdebug.ini (on Ubuntu 12.04 the file is located at /etc/php5/conf.d/xdebug.ini) configuration file.
xdebug.max_nesting_level = 500

xdebug.idekey = PHPSTORM
xdebug.remote_host = 127.0.0.1
xdebug.remote_enable = 1
xdebug.remote_port = 9000
xdebug.remote_handler = dbgp
xdebug.remote_mode = req
Browser Setup
Next you need to install a debug extension for you webbrowser. Since I use Google Chrome, I install the Xdebug helper, which is open source (on GitHub) and available on the Google Chrome Web Store.
PHPStorm Setup
Finally configure the server in you PhpStorm project settings like shown below.
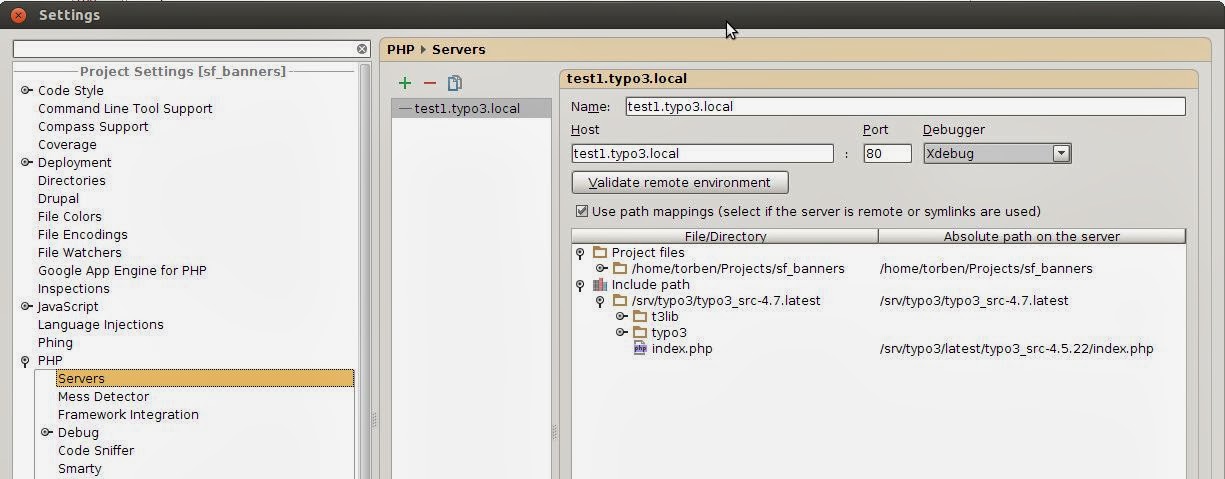 |
| Server Configuration |
There are 2 important things to keep in mind.
- The host must not contain http://
- Symlinked files/directories must be mapped manually. On the screenshot above I map the typo3_src folder and the project-folder to to real location on my filesystem.
Start debugging
Now it's time to start the debug session.
1. Enable your browser debug extension for the website you want to debug. In Chrome you just click on the debug icon.

2. Enable PhpStorm to listen to debug sessions by clicking on the icon shown below.
3. Set a breakpoint in your controller

4. Open the website on the server. PhpStorm now catches the incoming debug session and stops at the first breakpoint.

As you see on the screenshot above, PhpStorm stops at the breakpoint which has been set in step 3.
Happy debugging!
Troubleshooting
1. PhpStorm claims port 9000 is busy.
I had this error on an Ubuntu 12.04 development machine. Here php-fpm was installed and was listening on port 9000, so it was conflicting with XDebug. to resolve this problem I changed to port for php-fpm to listen to port 9001 instead by editing the configuration file /etc/php5/fpm/pool/www.conf
2. Debugger does'nt stop at breakpoint
When the debugger does'nt stop at the breakpoint, then it could be, that there is something wrong with the path mapping. I resolved this by adding xdebug_break(); to my code which resulted PhpStorm in stopping at the line with xdebug_break() and I could fix the path mappings at this point manually.