
No performance data from Icinga 2 to InfluxDB and how to possibly fix it
TL;DR: In Icinga Web 2, navigate to Toggle Menu > Health, click on the Icinga DB Instance, and ensure that Performance Data is enabled.
Icinga 2 and performance data
I use several own servers to run various services like my own TYPO3 website, my GitLab instance, and other applications I use for my daily work. When maintaining own servers and applications, one of the most important things is to keep the servers and applications secure and up to date. Another important thing is to keep an eye on the servers’ health and performance. To do so, I use Icinga 2, a free and open source monitoring solution, which is very popular and documented well. Icinga 2 offers the possibility to write performance data of monitored services into e.g. files or a database. Those performance data can be used to create graphs with third party tools like Grafana.
No graphs anymore
While doing some regular maintenance work on the Icinga 2 server, I noticed that no graphs were created anymore. I therefore checked the Influx database where performance data is stored and found out that the problem has already existed since August 2025. So this was the cause for the graphs not being created anymore.
Since I have not really changed anything in my setup, the problem must somehow be related to either an update of the server or one of the applications running on it (Icinga 2, MySQL, InfluxDB, and Grafana). I checked the Icinga 2 logs for hints on the problem, but could not really find anything useful. Next I checked the result of the services checked, and according to the Icinga 2 UI, the services successfully returned performance data. So somehow, the performance data was not written to the Influx database anymore.
Trying to solve the problem with AI
I could not find anything useful on the internet about this problem (expect one or two people in the Icinga 2 forum having the same problem), I ended up trying to get the problem fixed with the help of several AIs (ChatGPT, Gemini, and Junie). I described the problem very clearly, provided detailed information about my setup, and also attached the latest Icinga 2 logs, so that they could be analyzed.
Every AI suggested that I enable debug logging in Icinga 2 to get more information about the problem. The debug log included the following line message:
[2025-12-20 14:26:59 +0100] information/WorkQueue: #9 (InfluxdbWriter, influxdb) items: 0, rate: 0.0166667/s (1/min 1/5min 1/15min);
Every AI interpreted this message as a hint that the problem was related to the InfluxWriter. Possible solutions
suggested where adding library "perfdata" to influxdb.conf config file as well as adding
enable_send_metadata = true and enable_send_thresholds = true.
Additionally, AI suggested to check, if the Icinga 2 performance data feature was enabled by checking
Icinga 2 feature list and using Icinga 2 feature enable perfdata to enable it.
However, none of these solutions worked for me, and after wasting several hours in AI question/answer roundtrips leading the same suggestions, I gave up the AI approach and decided to resolve the problem the old-fashioned way
Updating to InfluxDB2
I spent some time searching the Icinga 2 forum for similar problems and found one post, where a user noted that InfluxDB 1.x may bo old and that InfluxDB 2.x could be used instead. I therefore updated my InfluxDB installation to version 2, but sadly, the problem still existed. Additionally, I now also had to deal with InfluxDB 2’s new authentication mechanism, which required me to change the authentication method in Grafana as well. However, after some hours of struggling, I came to the conclusion that the problem could not relate to InfluxDB, because I manually could write data to the InfluxDB database using curl.
Restoring a backup
As everything was working before August 2025, I decided to restore a backup of my Icinga 2 configuration. This, however, did not solve the problem, so the problem must most likely be related to a Icinga 2 configuration which may be located in the Icinga DB database.
Digging into the code of Icinga 2
Since Icinga 2 is Open Source and the UI Icinga Web 2 is based on PHP, I
decided to look into the code of Icinga 2 and try to find some hints on where to look for the problem. I searched
for the string performance_data in the source code and found out, that there is a table named icingadb_instance
in the Icinga DB database. This table contains the column Icinga 2_performance_data_enabled. After checking the
table on my Icinga 2 server, I found out that this column was set to n (meaning, the feature is disabled).
I had however no idea on, why this feature was disabled and how/where to enable it. So I again looked at the code and found the PHP the controller HealthController.php, which most likely was responsible for enabling the feature. So now I only had to find out where to get to the controller in the Icinga 2 UI. It turned out that this was “hidden” in the “Health” menu of Icinga 2.
Opening the “Health” menu, Icinga Web 2 showed the following screen:
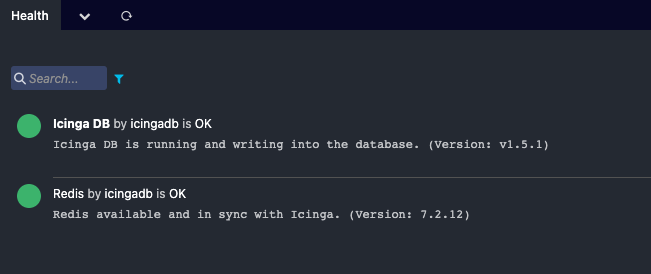
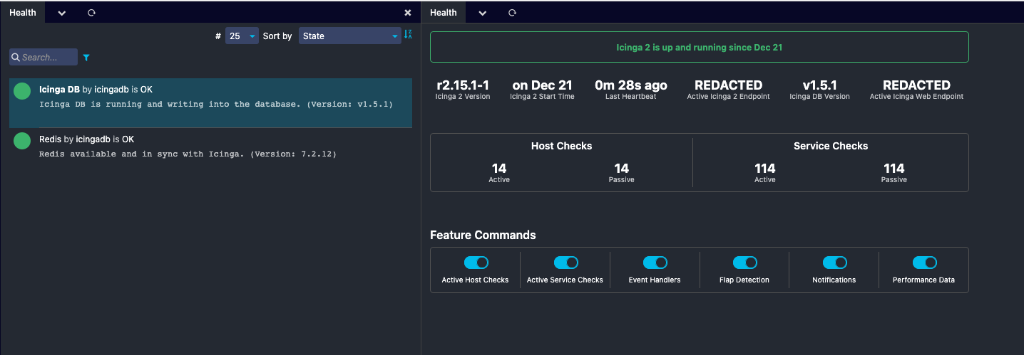
What is not visible is that the first item in the list can be clicked and opens the HealthController where
the features can be enabled/disabled.
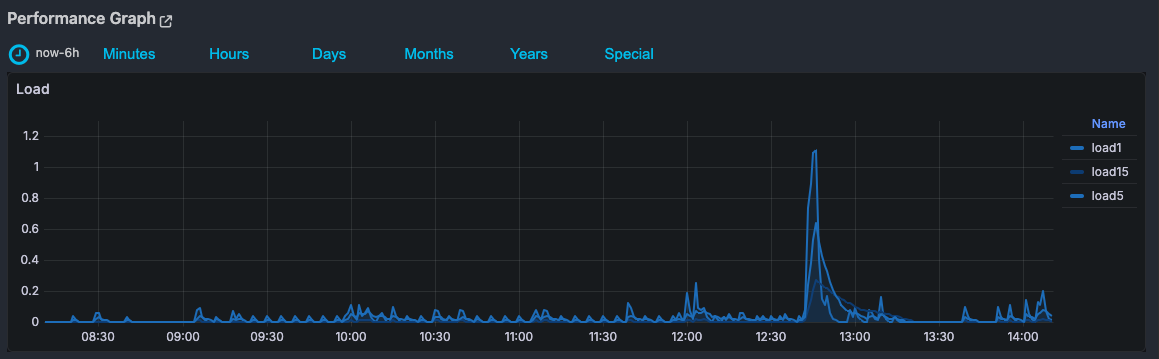
Finally, enabling the performance data feature solved the problem for me, and now I can see the graphs again.
I still have no idea why the performance data feature was disabled in the first place and guess it somehow might have been related to a regular Icinga 2 upgrade.
Learnings
All in all, it took me more than 8 hours to resolve the problem. It was an interesting experience with some good learnings:
- The
(InfluxdbWriter, influxdb) items: 0message has most likely nothing to do with the problem. Now with InfluxDB 2, those messages are still logged(Influxdb2Writer, influxdb2) items: 0, rate: 2.13333/s (128/min 639/5min 1912/15min);but performance data are now successfully written to the InfluxDB database. Icinga 2 feature enable perfdatais not required for InfluxDB writer to work.- AI was not very helpful this time and pointed me several times in the wrong direction.
- The performance data feature toggle is hard to find in the Icinga 2 UI.
Hopefully, this blogpost will help someone else who has the same problem.